Of the indicators worth watching as a retail investor, margin debt can be a bit of head scratcher. It is not a leading indicator, yet it is not exactly a coincidental one either. Margin balances tend to peak around the same time markets do, and the post-peak deleveraging often runs in front of the subsequent drawdown. The data itself is published several weeks after the fact, which means by the time the information is out there, the trade is basically over.
What margin debt actually indicates is the temperature of the room. And in late 2025 and early 2026, that temperature was blisteringly hot — the hottest in fact since 2021.
The $1.28 Trillion Print
FINRA tracks total margin debt across all member firms and publishes the number monthly. The October 2025 reading was an astonishing $1.2 trillion. November and December set new records. By the January 2026 print, total margin debt had reached $1.28 trillion, the ninth consecutive monthly record and a 4.4 percent rise over December. Year-over-year growth was over 38 percent. Real margin debt, adjusted for inflation, has grown roughly 505 percent since 1997, while the broader market has grown roughly 332 percent over the same window. The gap between the two has widened sharply since 2020.
Then it cooled. February 2026 was the first month of decline in the streak. March 2026 brought a second, with margin debt falling 2.6 percent month over month to $1.22 trillion. The S&P 500 was down 5.1 percent in March, sitting roughly 5.9 percent off its January nominal peak. Margin debt growth and equity market growth do not move in lockstep. The simultaneous turn in February and March, however, is the kind of pattern that has historically meant something.
Understanding Net Credit Balances
Tracking margin debt in isolation does not provide a clear picture. For clarity, Lance Roberts of Real Investment Advice recommends analyzing net credit balance, which adds free credit cash and credit balances in margin accounts, then subtracts margin debt from the total. When the number is positive, investors are net cash. When the number is negative, investors are net leveraged. The current reading is one of the most negative in the history of the series. As of January 2026, net credit balance hit a record low of more than negative $878 billion. As of March, the number had improved modestly, yet it is still nearly 10 percent above the all-time low and well outside historical comfort zones.
Translation: investors collectively owe their brokers roughly three quarters of a trillion dollars more than they hold in cash. Hedge fund borrowing has separately doubled in three years to $6.8 trillion, with gross leverage at all-time highs across multiple strategies. The retail picture and the institutional picture are both elevated. Everyone seems to be drinking the Kool-Aid and viewing the glass as half-full.
Margin Debt Held by Interactive Brokers
Interactive Brokers reports its own margin loan balance every quarter as part of earnings. The Q1 2026 number, disclosed by Chairman Thomas Peterffy on the call, was over $86 billion. Futures volumes hit a quarterly record, up 20 percent year over year. Commission and margin loan growth are largely independent of the rate environment, which gives IBKR a real fundamental tailwind in the cross-section of brokerage stocks.
The bear case on IBKR itself is rate sensitivity. CFO Paul Brody confirmed that a quarter point interest rate cut from the Fed reduces annual net interest income by approximately $82 million. With quarterly net interest income at $904 million, a faster-than-expected easing cycle would substantially decrease the earnings base supporting the multiple. That is a real risk worth stating plainly. Does this mean investors should consider shorting IBKR and other financial stocks if interest rates fall? Who knows.
What the IBKR data confirms is that the leverage in the system is not isolated to the headline FINRA number. The brokerage industry's premier institution for active and sophisticated traders is also showing record borrowing alongside record futures activity. Retail and semi-professional positioning is, in aggregate, leveraged and aggressive.
(IBKR is a holding I track closely and the platform I use for a portion of my own portfolio. Readers who are looking for institutional-grade execution can open an account using my referral link. Through the IBKR Refer-a-Friend program, the referred client receives $1 in IBKR Class A stock for every $100 deposited within the first year of the account, up to $1,000 in stock. I receive a $200 referral bonus once the account meets the deposit and balance requirements. The reader gets what is widely considered the best execution stack outside of an institution, plus a stake in the company itself.)
Separating the Wheat from the Chaff
Records do not predict crashes. The dot-com peak in 2000, the 2007 high, and the apex reached in 2021 were all preceded by record margin balances. Of course, those tops were followed by meaningful drawdowns. The record from 2018 was followed by a sharp but recoverable correction. The data point is necessary context, not a crystal ball.
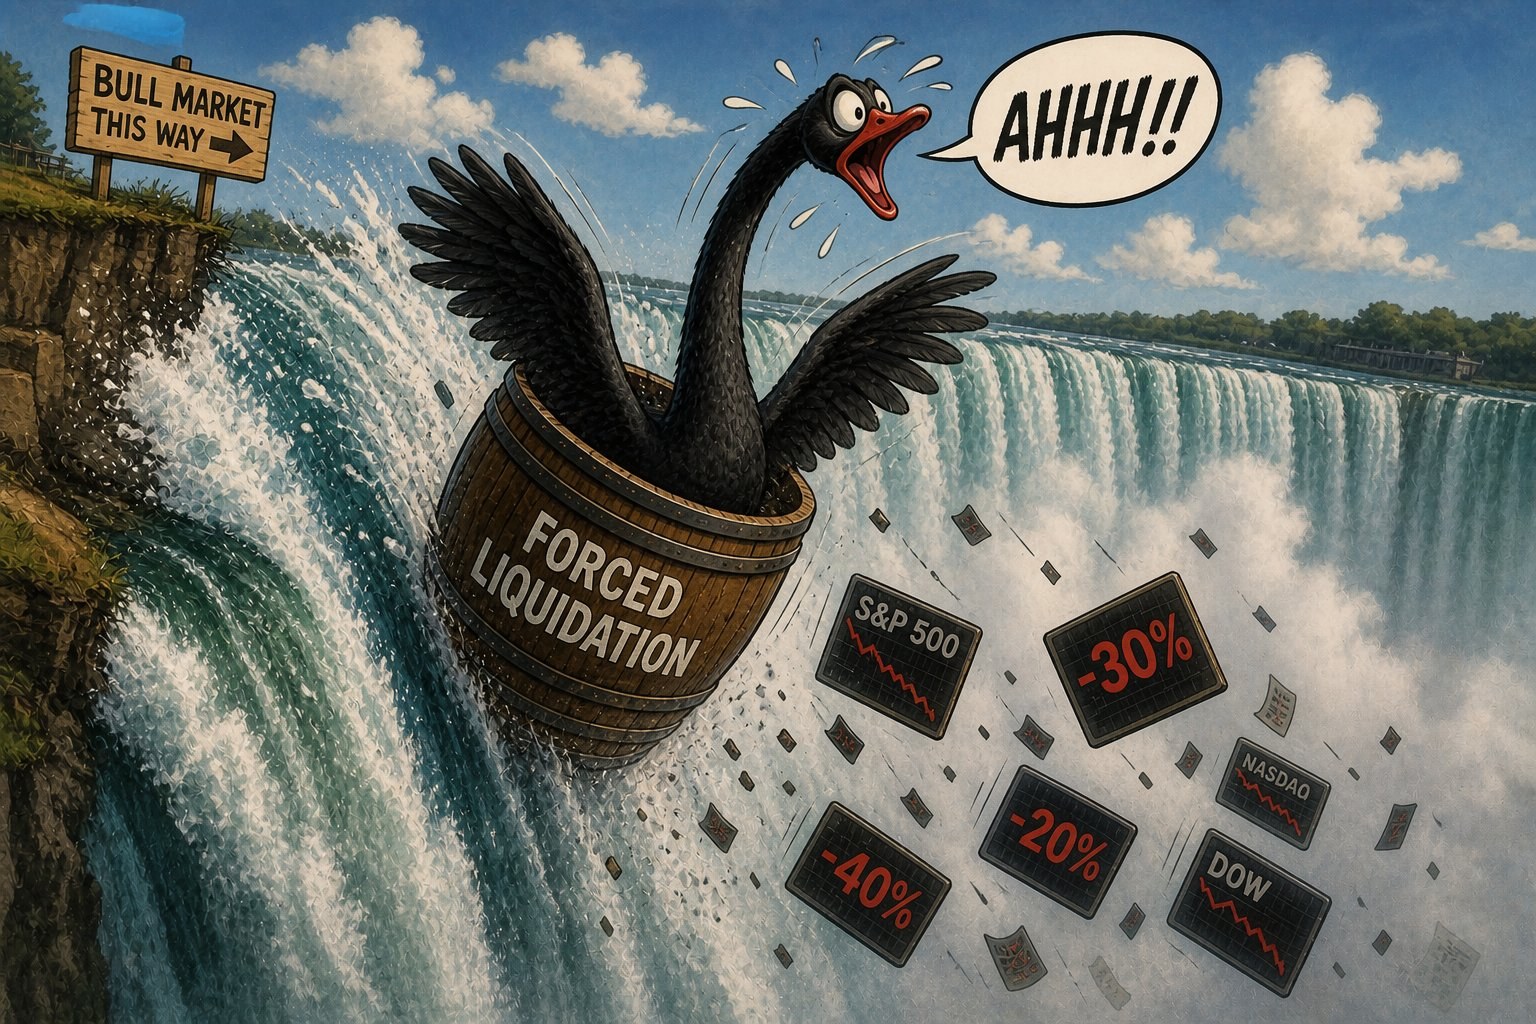
Rising margin debt reduces margin for error. When more of the equity ownership is bought with borrowed money, an unfavorable surprise produces forced selling. That selling produces price pressure. That pressure produces margin calls at the next tier of leveraged accounts, and the cascade compounds quickly.
This is not a conspiracy theory. It is the mechanical truth of any leveraged system, and the speed of the cascade is exactly why margin calls show up in the historical record at every major correction.
Retail Signals Worth Tracking
Three numbers, monthly: the FINRA total margin debt headline, the month-over-month change, and the net credit balance. These are all free to research on the FINRA website or on Advisor Perspectives. None of them require a Bloomberg terminal. Watching them quarterly will not give you an edge. Watching them monthly will not either, in any actionable sense. What watching them does, over years, is calibrate intuition. When margin balances are at records and rising, the historical data shows this is the second half of an up cycle. When margin is declining, a transition may be occurring. When margin balances are spiraling lower, a deleveraging event is taking place.
March 2026 was the first hint of transition. April will tell us whether the cooling continues or whether the dip is a bounce. The right posture, in the meantime, is the one I default to when the room is hot. Sized positions. No new leverage. Cash on hand. Optionality preserved.
I have been participating in financial markets for roughly 20 years. Buying at the top is not always the worst possible mistake. Markets trend higher over time, after all. Buying on margin at the top is a different story. Using cash for investments, keeping an emergency fund, and maintaining a healthy amount of margin buying power can function as a security blanket.
The other side of this coin is the human one. The history of margin, the math that looks like free money, and the names that transformed into cautionary tales. That piece is its own essay, one that I would like to invite you to read as a companion to this one.
Check it out: Is Using Margin Ever a Good Idea?
Nothing in this article is investment advice. The Pinnacle is one writer's analysis. Do your own research, talk to a licensed advisor, and never put money into anything you do not understand.